WILL THE NATION see the return of a virulent war on drugs?
Nine days after he issued a memorandum placing the Philippine Drug Enforcement Agency (PDEA) as the “sole agency” in charge of the drug war, President Rodrigo R. Duterte said at a forum of overseas Filipino workers last Oct. 19: “You have been downgrading the drugs problem. Okay. I ordered the military and the police out of the picture. Lahat. Only PDEA.”
Then again, he added: “Now, the question you will ask is, ‘Would this be… Would this agency, a single one sufficient to meet the challenges of the drug problem? Would there be enough resources for this agency to deal with the problem effectively?’ I don’t know. I don’t know because I myself has distanced.”
Before a reboot of the drug war happens again, let us look at the data, from 1995 to the latest available, on the context of public order, safety, and drugs in the Philippines.
PCIJ’s Data Team curated and organized reports from the Philippine National Police, Philippine Statistics Authority, Bureau of Jail Management and Penology, and Bureau of Corrections, among other official sources, to build this database.
It offers the big picture on how bad the policemen to citizen ratio is; the relentess rise in the crime rate in nearly all the regions of the country; why local jails are, like cans of sardine, dark, packed, and harsh; and a profile of drug abuse patients in rehabilitation facilities, by age, educational background, prior employment, and mode of drug use.
For more unique, time-series data, check out Public Order, Safety and Justice in PCIJ’s MoneyPolitics Online.
COPS TO CITIZEN RATIO: BELOW PAR
THE PHILIPPINE population has grown by leaps and bounds in the last three decades, and unfortunately, so has the country’s crime rate. More unfortunately, the nation’s police force has been hard-pressed keeping up with these trends, as has the penitentiary system, among others.
The standard police to population ratio mandated by law in this country is 1:500. In 1990, that ratio was at 1:1,127. The following year saw that plunge to 1:696, but since then until 2014, the annual police to population ratio remained below the standard, ranging from 1:630 to 1:746, according to data from the Philippine National Police and the Philippine Statistics Authority.
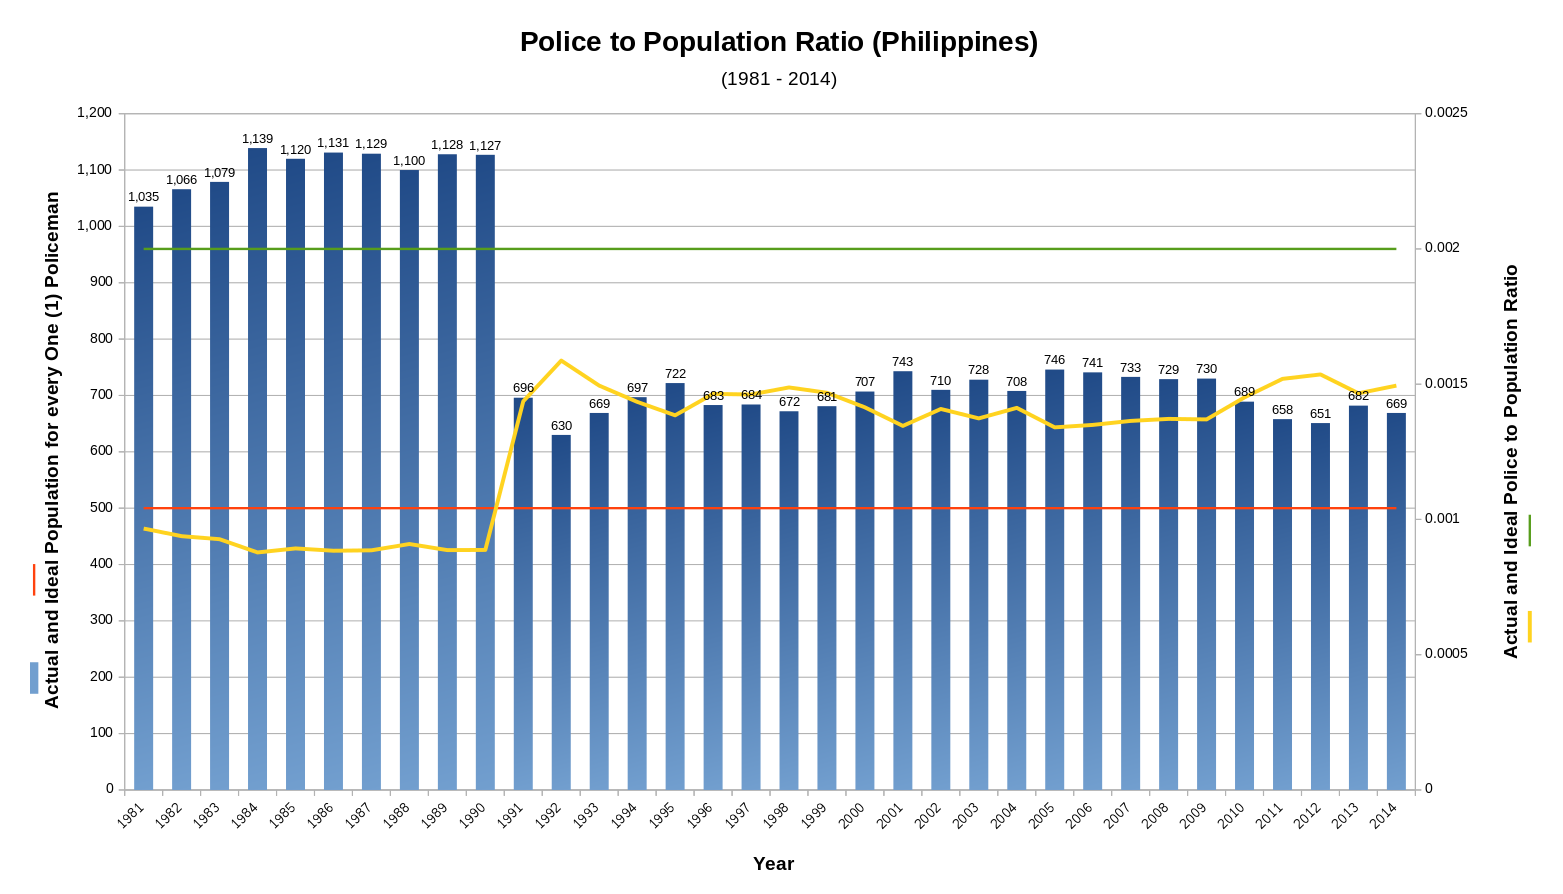
Figure 1. Population-to-police ratio, from 1981 to 2014. Sources: Philippine National Police (PNP) and Philippine Statistics Authority (PSA)
Through the years, criminals were keeping the police very busy. From 2012 to 2013 alone, the crime rate in all the regions of the Philippines increased by more than 100 percent. From 2009 to 2014, 14 or more than 80 percent of the 17 regions recorded their highest crime rate in 2013. The crime rate in Region 6 (Western Visayas) even jumped by 1,141 percent between 2012 and 2013: from 106.6 1,323.

Figure 2. Crime rate by region, from 2009 to 2014. Sources: Philippine National Police (PNP) and Philippine Statistics Authority (PSA)
CRIME RATE RISING, RISING
The Autonomous Region in Muslim Mindanao, which had the lowest crime rate among the regions since 2009, saw its crime rate increase by 619 percent between 2012 and 2013, with the figure rising from 24.86 to 178.76.
In 2014, however, the crime rate in these 14 regions dropped while the remaining three regions went up — by one percent in Ilocos, eight percent in CALABARZON, and 17 percent in Eastern Visayas. Still, it was the Cordillera Administrative Region (CAR) that had the highest crime rate in 2014 at 1,191, followed by the National Capital Region with 1,178.7, and Zamboanga Peninsula (Region 10) at 1,016.9.
TOO MANY INMATES, FEW & CRAMPED JAILS
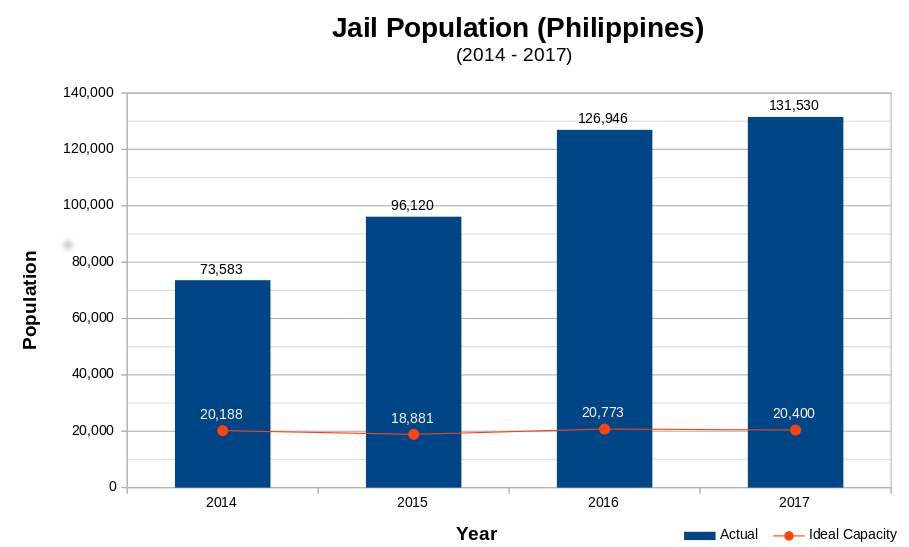
Figure 3. Philippine jail population, from 2014 to 2017. Sources: Bureau of Jail Management and Penology (BJMP) and Philippine Statistics Authority (PSA)
Over the last three years, the contry’s jail population has continued to rise.
The total number of inmates increased by 31 percent, from 73,583 in 2014 to 92,120 in 2015. It rose further by 32 percent or 126,946 in 2016. By January 2017, data from the Bureau of Jail Management and Penology (BJMP) place the Philippines’ total jail population at 131,530 inmates.
Despite the bursting jail population, the government has built only six new jails since 2014, bringing the total number of jails to 466 nationwide. The BJMP puts the ideal cell area per inmate at 4.7 square meters.

Figure 4. Floor and cell area of jails in the Philippines. Sources: Bureau of Jail Management and Penology (BJMP) and Philippine Statistics Authority (PSA)
Jails in the Philippines are like cans of sardine — dark, packed, harsh. The total cell area of jails in the country has fattened and thinned through the years. From 94,879 square meters in 2014, it decreased to 88,742 square meters in 2015, swelled to 97,613 square meters in 2016, but again contracted to 95,941 square meters by January 2017.
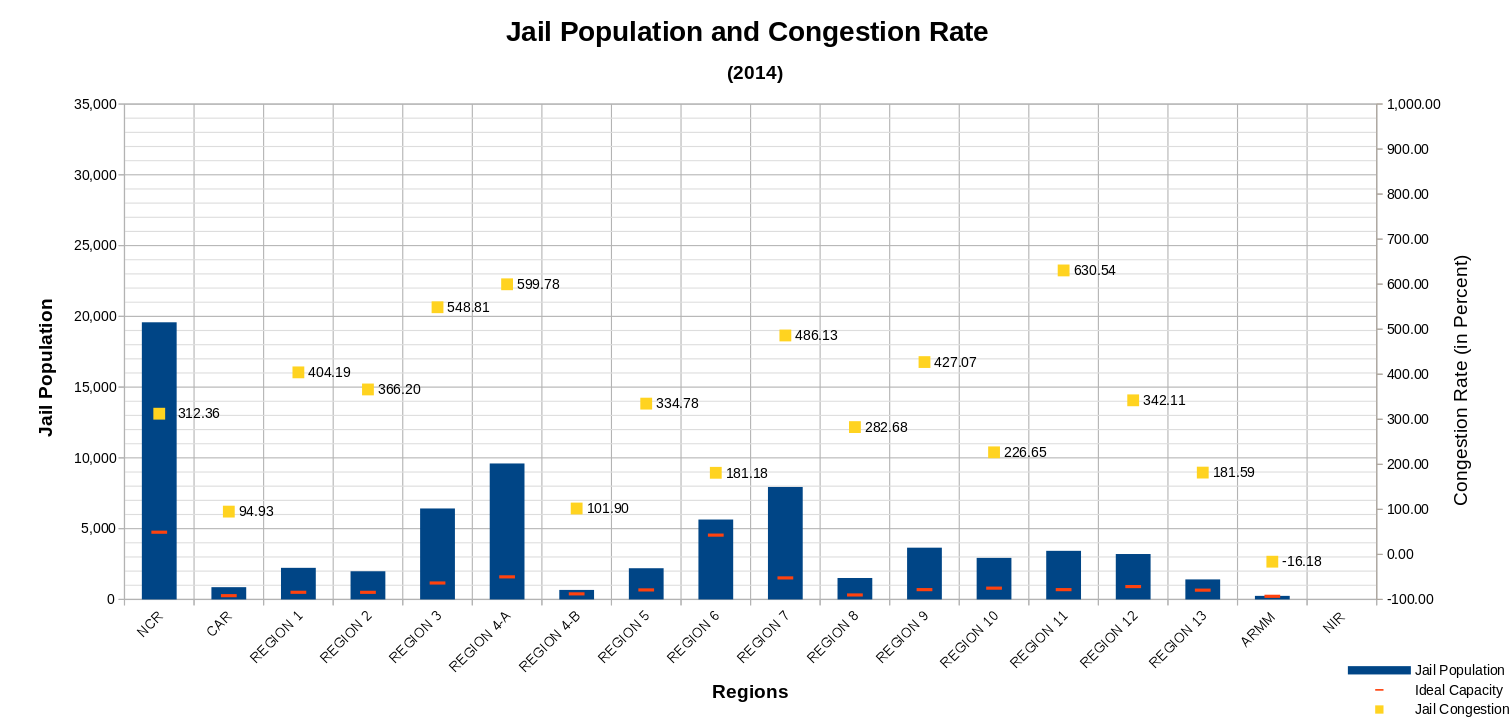
Figure 5.1. Jail population and congestion rate by region, 2014. Sources: Bureau of Jail Management and Penology (BJMP) and Philippine Statistics Authority (PSA)
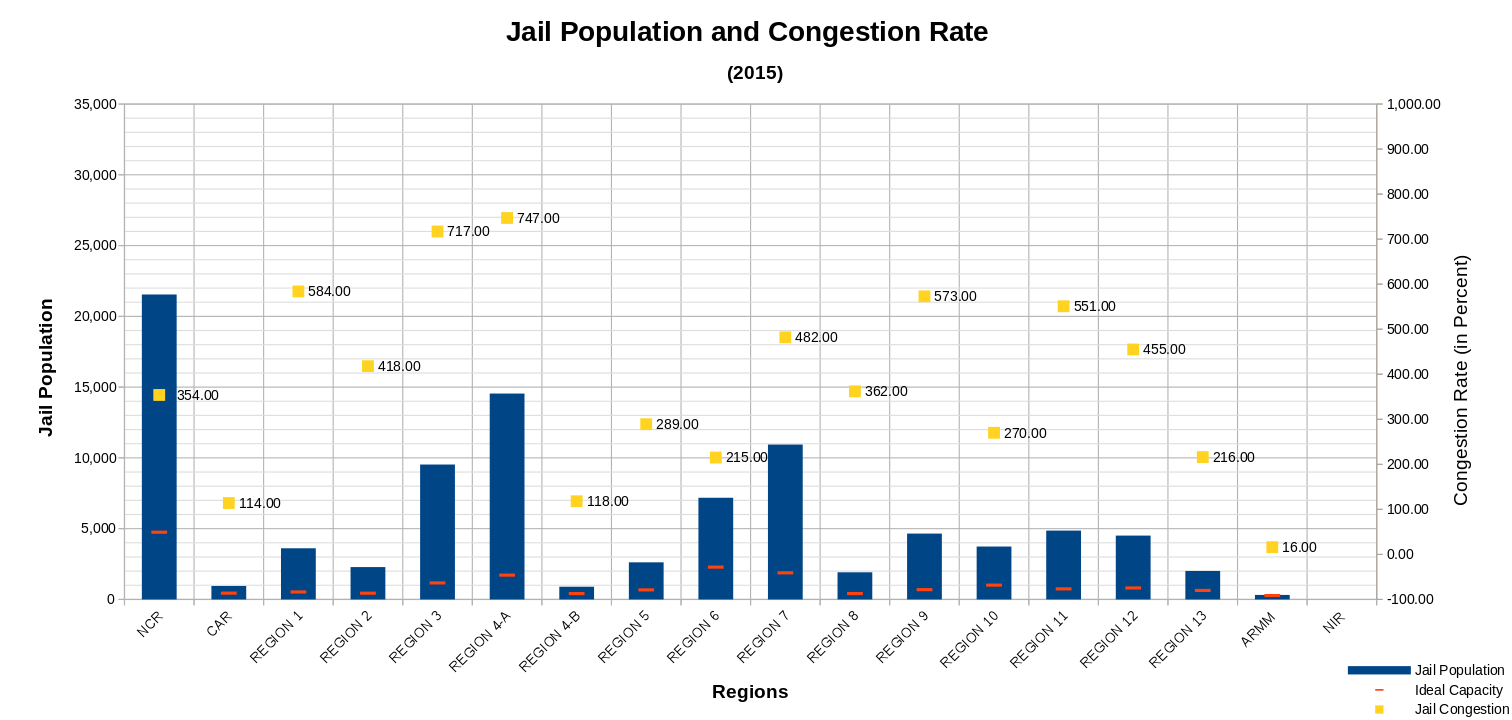
Figure 5.2. Jail population and congestion rate by region, 2015. Sources: Bureau of Jail Management and Penology (BJMP) and Philippine Statistics Authority (PSA)
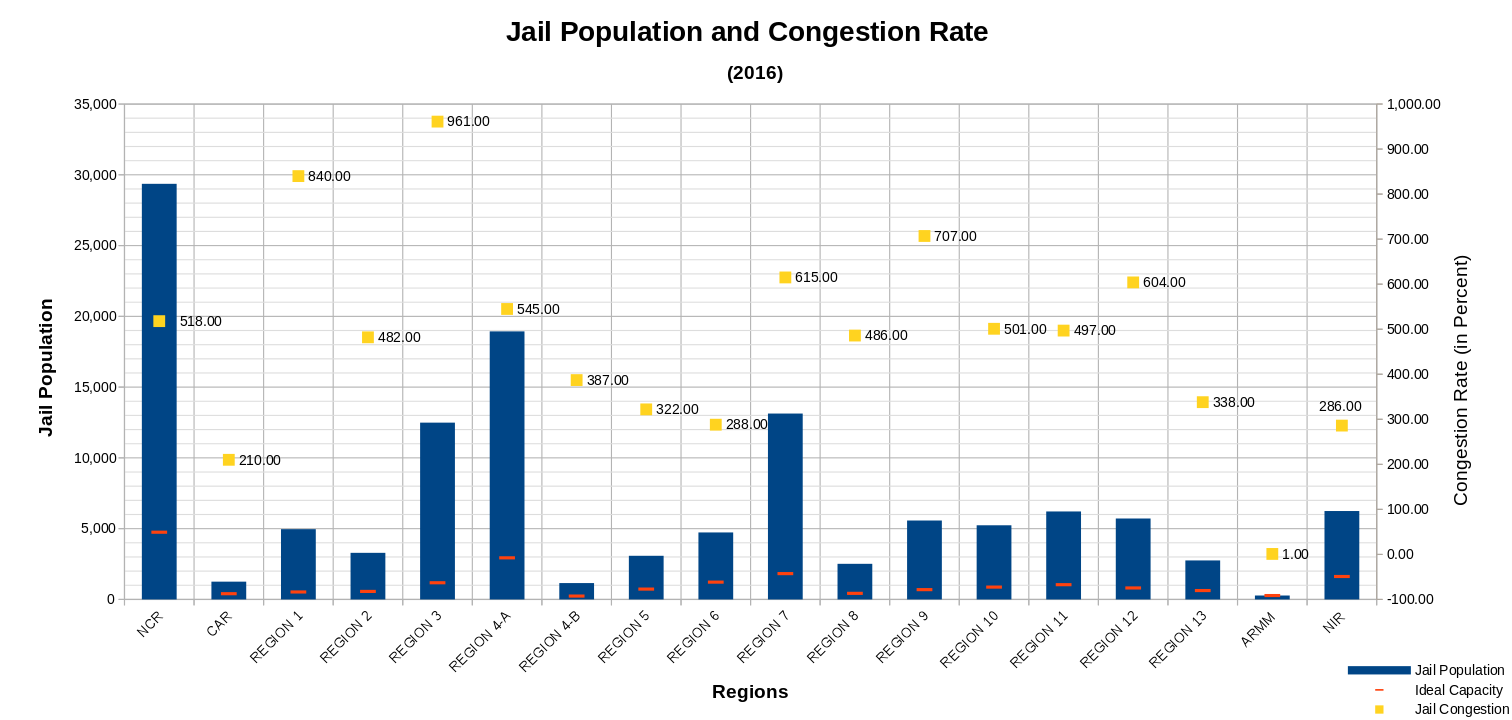
Figure 5.3. Jail population and congestion rate by region, 2016. Sources: Bureau of Jail Management and Penology (BJMP) and Philippine Statistics Authority (PSA)
With so many inmates for so few, packed jails, the congestion rate has regressed from 259 percent in 2014 to 409 percent in 2015. The next year, 2016, the congestion rate turned for the worse to a 511 percent congestion rate, and worsened further to 544 percent in 2017.
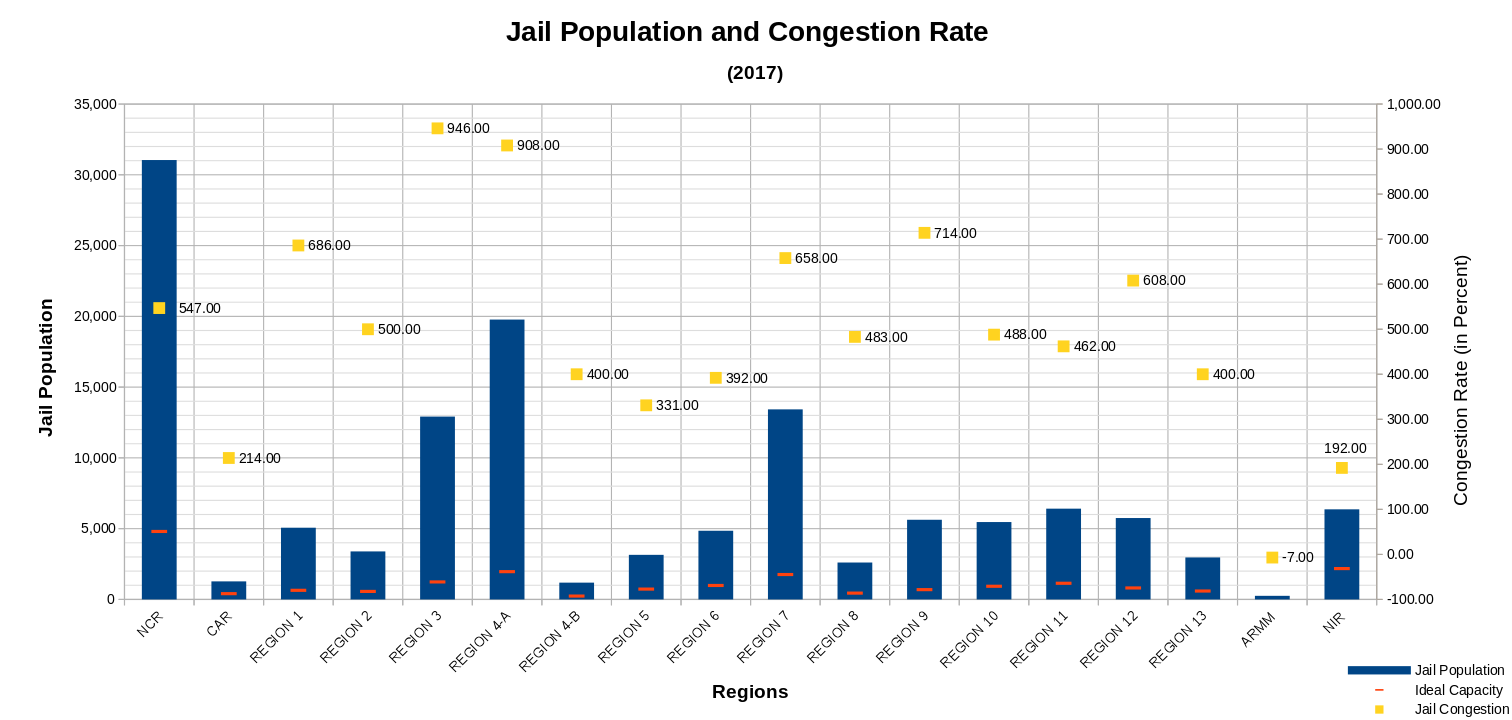
Figure 5.4. Jail population and congestion rate by region, 2017. Sources: Bureau of Jail Management and Penology (BJMP) and Philippine Statistics Authority (PSA)
Central Luzon (Region3) has the most congested jails of all the regions. It has 36 jails with a total cell area of 5,806 square meters, but also a total of 12,918 inmates, as of government’s January 2017 data. The ideal capacity of jails in the region should be 1,235 inmates only, or just 10 percent of its total inmates population. Central Luzon’s jail congestion rate stands at 946 percent, according to the Bureau of Jail Management and Penology (BJMP).
Region IV-A or CALABARZON has the most number of jails in the country with total cell area of 9,244 square meters. Its ideal jail capacity is only 1,963 inmates but the actual number of inmates it hosts is 19,773. Its jail congestion rate of 908 percent is the second worst in the country.
As of January 2017, Negros Island Region has the largest jail area at 85,395 square meters, followed by the National Capital Region (NCR or Metro Manila) with 49,440 square meters. In terms of cell area, though, NCR has the largest cell area of 22,562 square meters, followed by NIR with 10,242 square meters. Notwithstanding its bigger jails, the NCR’s jail congestion rate remains bad at 547 percent, compared with NIR’s 192 percent.
With only 16 jails, the Autonomous Region in Muslim Mindanao (ARMM) is the only region in the country with no overcrowded jails. Its ideal jail capacity is 275 inmates, yet its total jail population is only 255.
Across the nation, there are 466 jails with combined total cell area of 95,941 and an ideal capacity of 20,400 inmates. There are, however, 131,530 total inmates in all, putting the national jail congestion rate at a tragic 544 percent.
WHO ARE IN JAIL?
The total number of inmates in Philippine jails has risen without let-up from 2002 to 2014, data from the Bureau of Corrections (BuCor) show.
Eight major jails — the Philippine Military Academy, National Bilibid Prison, Correctional Institution for Women, Iwahig Prison Facility, Davao Prison and Penal Farm, San Ramon Prison and Penal Farm, Sablayan Prison and Penal Farm, and, Leyte Regional Prison — hosted a total of 25,002 inmates in 2002. A dozen years later, in 2014, the number of inmates in these prison facilities has grown to 40,745.
Age group
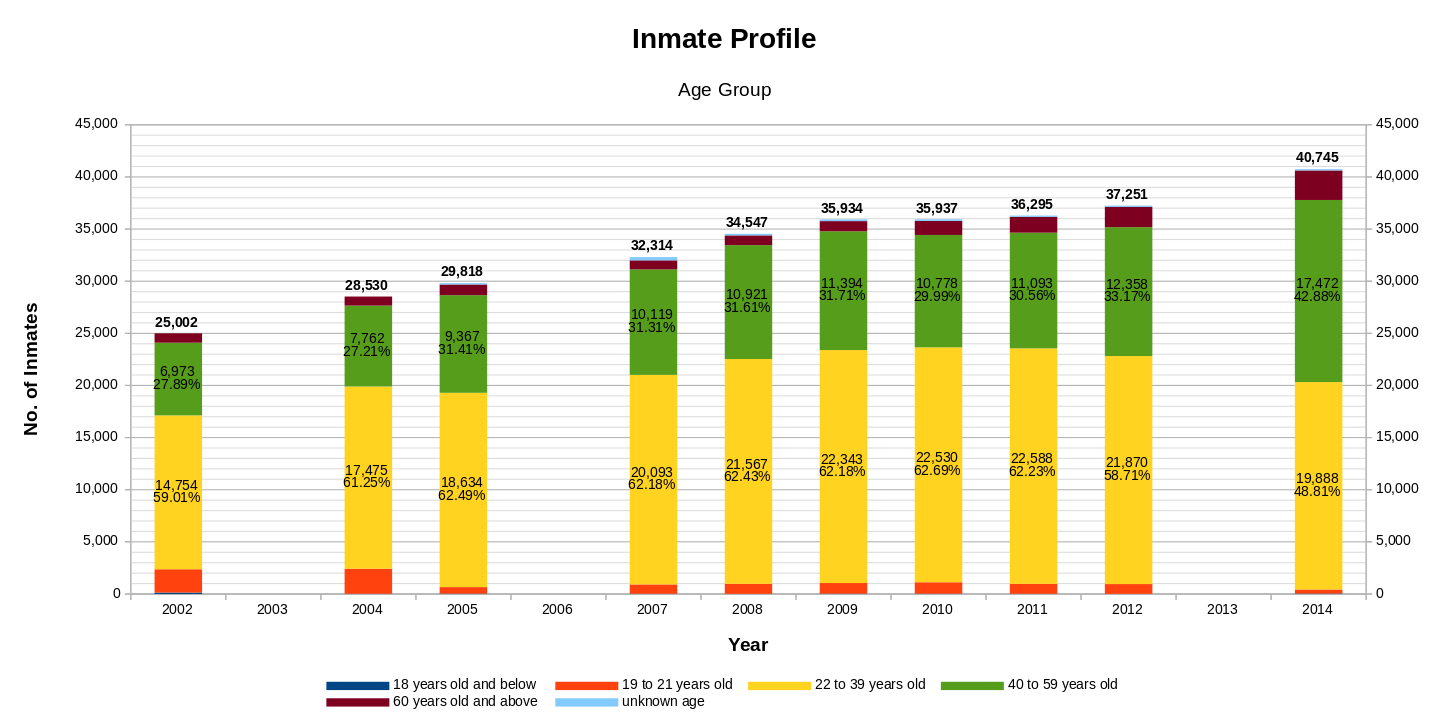
Figure 6. Profile of inmates by age group, from 2002 to 2014. Sources: Bureau of Correctuions (BuCor) and Philippine Statistics Authority (PSA)
From 2002 until 2012, more than half of prison inmates came from the age group 22 to 39 years old. In 2014, however, inmates from this age group decreased to less than 50 percent, or 19,888 of the total inmate population of 40,745.
Inmates aged 40 to 59 years old comprise more than 30 percent of inmates in the eight prison facilities cited above in 2002. From only 6,973 inmates in 2002, and 12,358 in 2012, the inmates population from this age group increased sharply to 17,472 in 2014. The latest figure accounts for 43 percent of the total inmate population in 2014.
Combined, the two age groups — 22 to 39 years old and 40 to 59 years old — account for 87 to 90 percent of total inmates in these eight facilities, since 2002.
Yet still, the number of inmates aged 60 or older in prison facilities run by the Bureau of Corrections has also increased from 902 in 2002 to 2,831 in 2014.
Inmates aged 19 to 21 years old have risen and fallen in numbers through the years: From 2,234 in 2002, it dipped to 957 in 2008, rose to 1,097 in 2010, and dipped again to 389 in 2014, according to BuCor.
Educational background

Figure 7. Profile of inmates by educational attainment, from 2002 to 2014. Sources: Bureau of Correctuions (BuCor) and Philippine Statistics Authority (PSA)
Over half of all inmates in Philippine prison facilities have reached elementary level of education only, data form 2002 to 2014 of the Bureau of Corrections show. As of 2014, 20,712 or 51 percent of all inmates had access to basic education, including a portion who graduated from elementary schools.
Inmates who received or finished high school education acount for a third of the total population in jail.
Only 10 percent or 1 in every 10 inmates had a chance to go to college but only a small fraction graduated or received college degrees.
A negligible one to two percent of inmates had enrolled in vocational or other levels of education.
The balance of 5 percent of inmates had received no education at all. The number of illiterate inmates, 1,483 in 2002, grew to 2,117 in 2014.
Employment
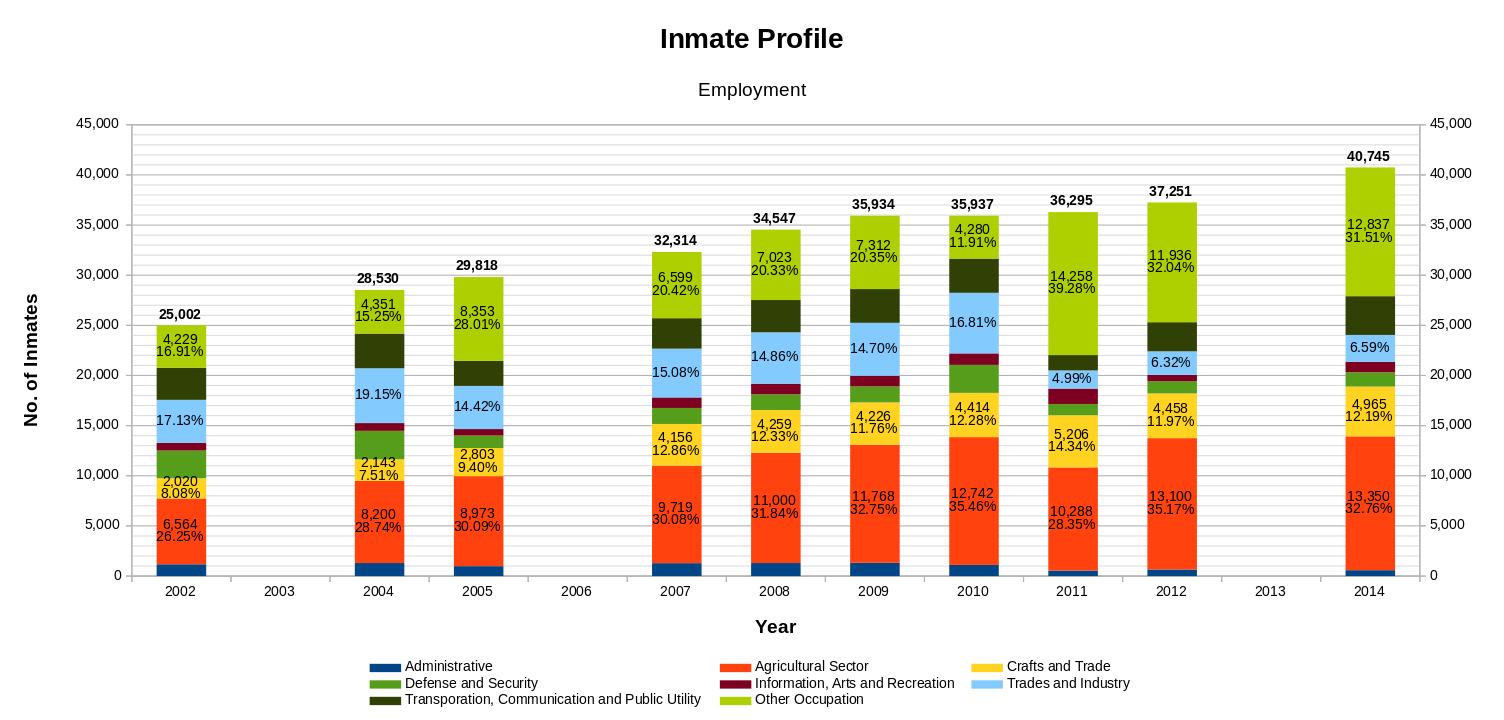
Figure 8. Profile of inmates by employment, from 2002 to 2014. Sources: Bureau of Corrections (BuCor) and Philippine Statistics Authority (PSA)
In terms of livelihood, a third of inmates in Philippine jails came from the agriculture sector — 6,564 in 2002 but reached 13,350 in 2014, or 33 percent of total inmates that year. Before landing in prison, they had worked as farmers or gardeners.
Inmates previously employed in Crafts and Trades, Information, Arts and Recreation showed a similar steady increase in numbers over the years.
In 2014, Inmates from Crafts and Trades comprised 12 percent of the total inmate population in BuCor’s prison facilities, while another 3 percent came from the Information, Arts, and Recreation sectors.
From 2002 to 2014, inmates from the Trades and Industry, Defense and Security, and Administrative sectors recorded declining numbers.
In 2002, the 4,284 inmates employed in Trades and Industry accounted for 17 percent of the inmate population of BuCor. This continued to increase from 6,041 in 2010 to 1,810 in 2011. In succeeding years until 2014, this sector accounted for only five to seven percent of inmate population.
Inmates previously employed in the Administrative sector also decreased from 1,109 to 543 in 2011 to 582 in 2014. This sector is the smallest group of inmates in BuCor’s prisons.
From the Defense and Security sector came 2,758 inmates in 2002. This number declined to 1,419 by 2014, just three percent of BuCor’s inmate population.
The balance of 32 percent of inmates were listed to have uncategorized occupation or under the “others” category of BuCor. In 2002, this category had 4,229 inmates, a number that tripled to 12,837 or 32 percent of the total population of inmates, in 2014.
A majority of inmates had been charged with crimes against person, notably murder, homicide, physical injury, and rape.
DRUG ABUSE: PROFILES FROM DATA
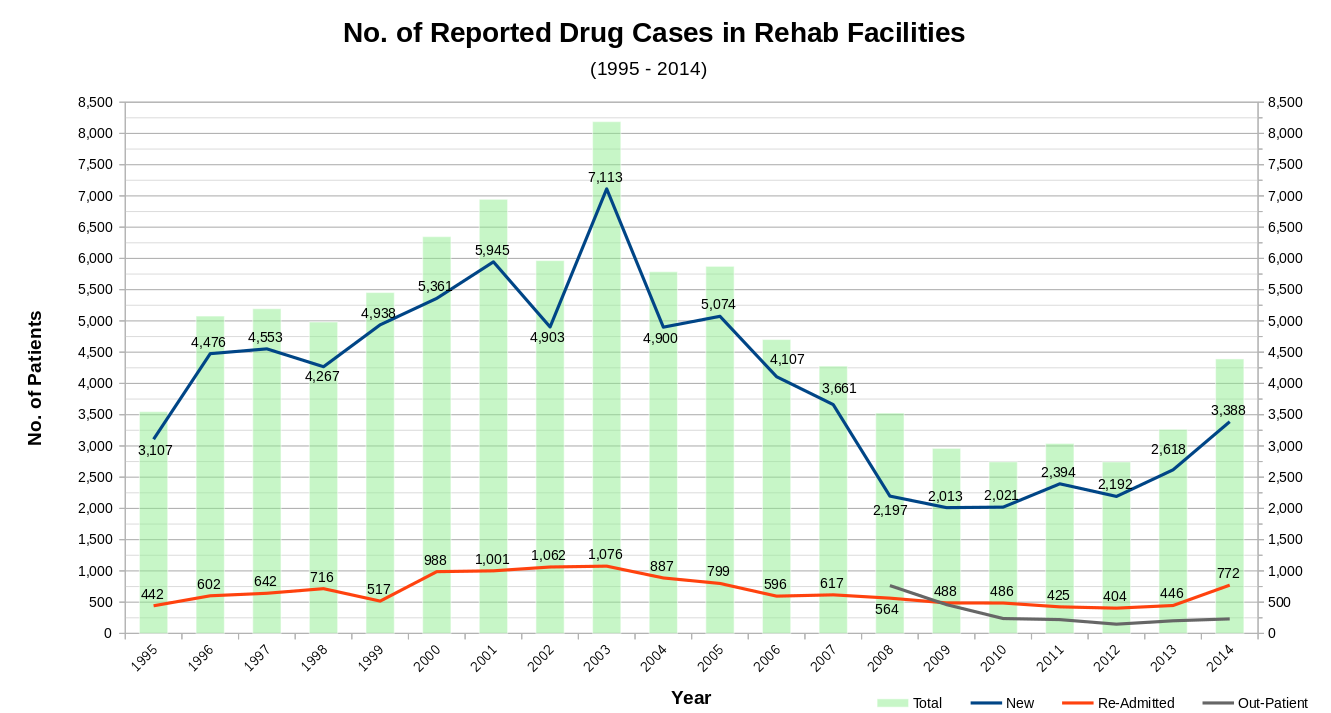
Figure 9. Reported drug cases in rehabilitation facilities, from 1995 to 2014. Sources: Dangerous Drugs Board and Philippine Statistics Authority (PSA)
Over the last two decades, the number of residents in drug rehabilitation facilities in the country has risen and fallen, according to data from Dangerous Drugs Board and the Philippine Statistics Authority.
In 1995, there were 3,549 reported cases of drug abuse admitted in these facilities. It rose to 8,189 in 2003, declined in the next 10 years, and started to rise again from 2011 to 2014. Eighty percent of the total admissions were new cases, and the balance, re-admitted patients.
The number of drug abusers — newly admitted and re-admitted in rehab facilities– has charted an up-down track. From 5,787 patients in 2004, it rose slightly to 5,873 in 2005. The figure thinned by more than half to 2,744 patients in 2012, but again expanded to 4,392 in 2014.
The number of re-admitted patients nearly doubled from 517 in 1998 to 988 in 1999. The number continued to rise until 2004, and then dipped from 1,076 in 2003 to 887 in 2004. It marked a 73-percent increase, however, in 2014 (772 patients) from only 446 patients in 2013.
As of 2014, the ratio of male to female drug abusers was 12:1. Males account for a majority of reported drug abuse cases in residential and out-patient rehabilitation facilities.
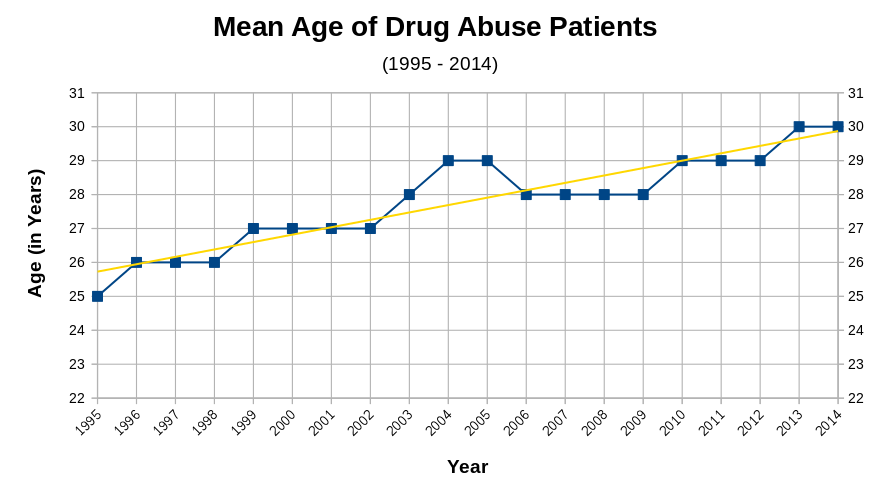
Figure 10. Profile of drug abuse patients by mean age, from 1995 to 2014. Sources: Dangerous Drugs Board and Philippine Statistics Authority (PSA)
Over the last 20 years, the mean age of drug abusers has shifted from 25 years old in 1995 to 30 years old in 2014.
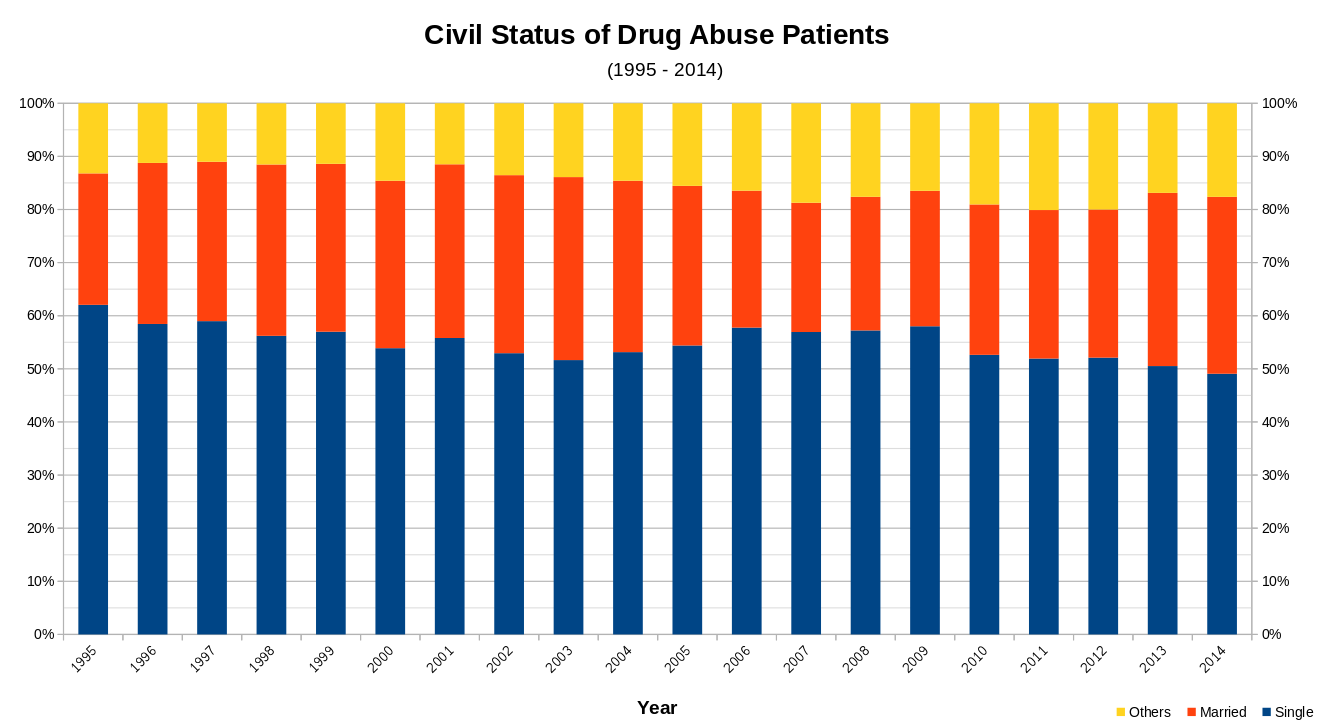
Figure 11. Profile of drug abuse patients by civil status, from 1995 to 2014 Sources: Dangerous Drugs Board and Philippine Statistics Authority (PSA)
More than half of drug abusers admitted in rehabilitation facilities from 1995 to 2013 are single, and only a third are married.
A majority of drug abusers had high school and college education. However, from 1995 to 1999, the number of drug abusers who reached high school decreased, while those who reached college, increased.
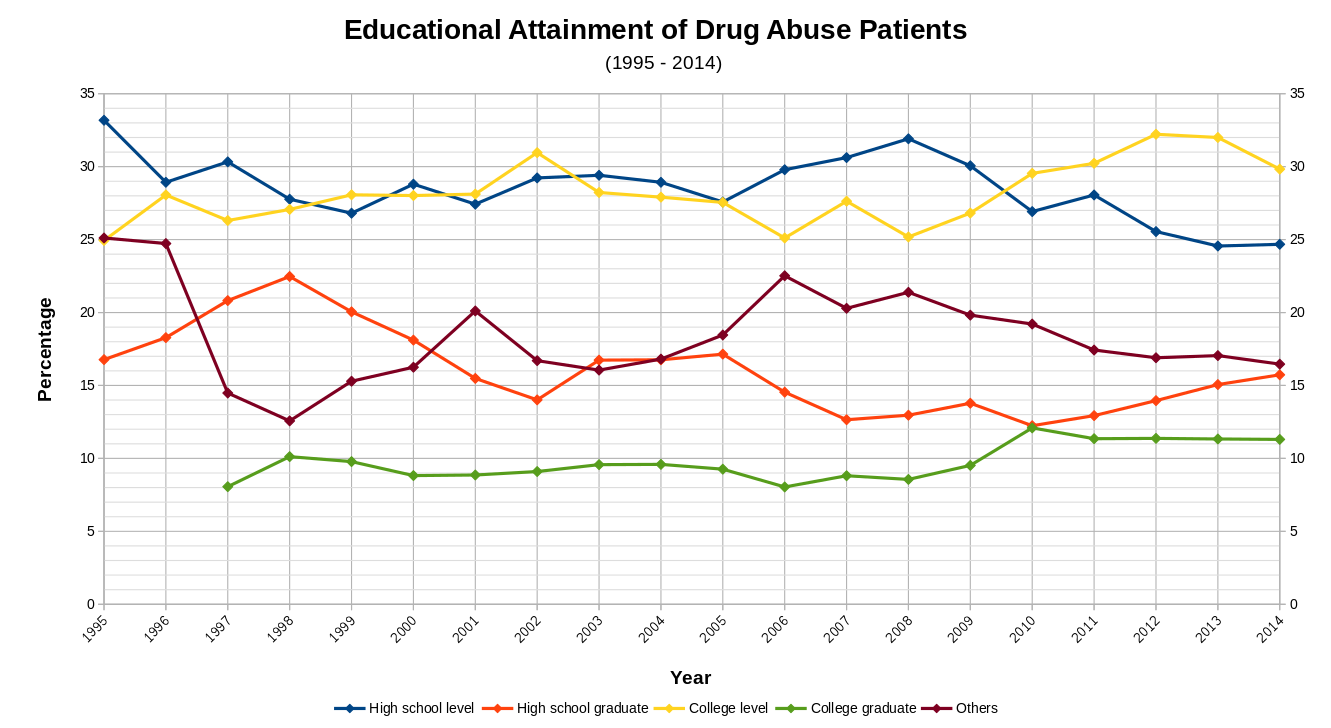
Figure 12. Profile of drug abuse patients by educational attainment, from 1995 to 2014. Sources: Dangerous Drugs Board and Philippine Statistics Authority (PSA)
In 2006, new ratios emerged: a third of drug abusers had high school education, and 25 percent, college education. From 2010 to 2014, drug abusers who had reached college level continued to increase in numbers, accounting for a third of all drug abusers in rehab facilities.
Data as of 2014 follow: 30 percent of drug abusers had gone to college; 25 percent had reached high school; 16 percent were high school graduates; and 11 percent college graduates.
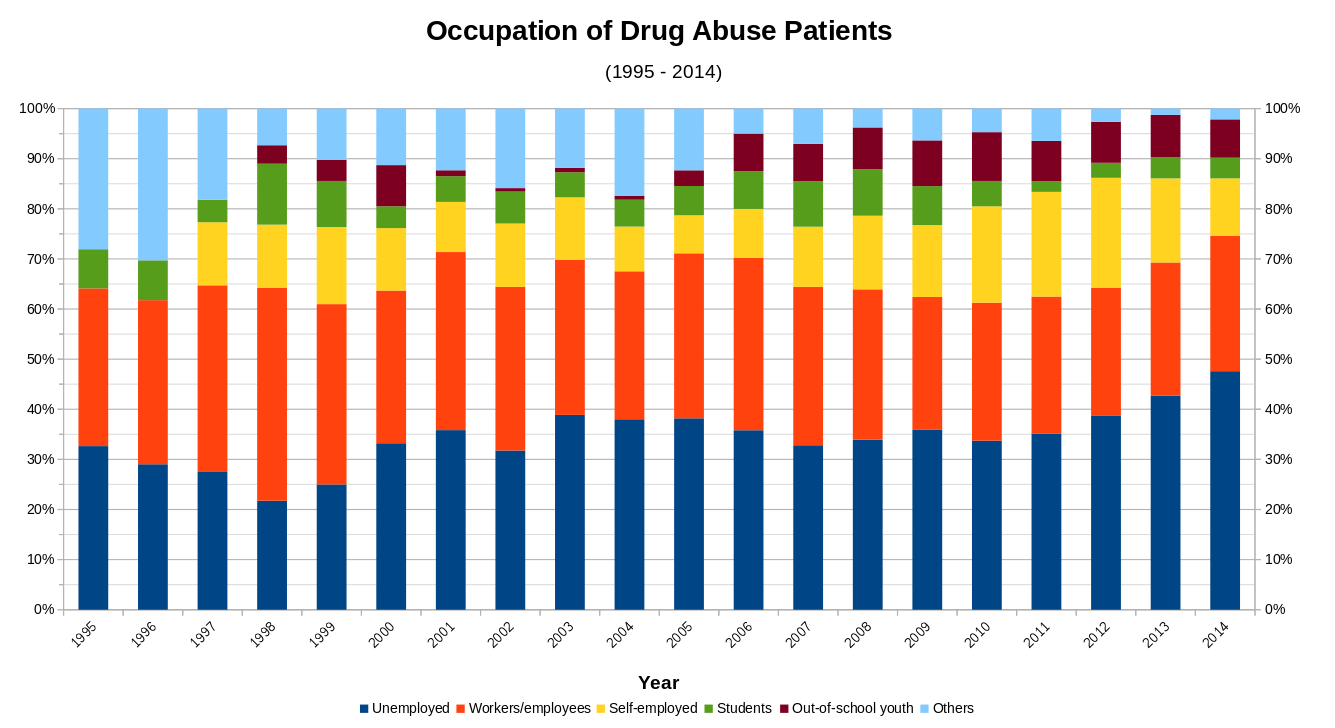
Figure 13. Profile of drug abuse patients by occupation, from 1995 to 2014. Sources: Dangerous Drugs Board and Philippine Statistics Authority (PSA)
Most drug abusers in rehab facilities today were unemployed. This is in contrast to the picture from 1995 to 2002 when most of the patients were listed to have been employed, including 43 percent of the total in 1998.
The data show a steady increase in the number of unemployed drug abusers, from 39 percent in 2003 to 47.6 percent in 2014. At the same time, the number of employed drug abusers continued to decline during the same period — from 30.9 percent in 2013 to 27 percent the next year. The rest of drug abusers were self-employed, students, and out-of-school youth, among others.
A majority of drug abusers came from urban areas, specifically Metro Manila.
A majority, too, had been taking drugs for more than six years.
From 1999 to 2002, mono-drug use was the dominant mode of drug use, with Methamphetamine Hydrochloride (shabu) and marijuana as the most common drugs of choice. From 2003 to 2014, however, poly-drug abuse became the dominant mode of drug use, with shabu and marijuana still the most commonly abused.
See more data on Public Order, Safety and Justice in PCIJ’s MoneyPolitics Online.
— PCIJ, November 2017